
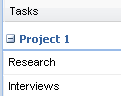
This example is a very basic implementation of the Ext Gantt, loading XML data.
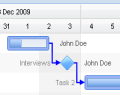
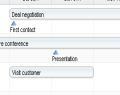
This example shows a more advanced implementation of the Ext Gantt, you can setup inter-task dependencies easily by using drag and drop.

Learn how easy it is to change the appearance of the Gantt chart using only CSS.
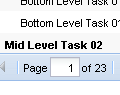
This example is a simple demonstration of how you can use paging to work with large datasets.

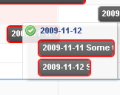
This is example shows you how you can validate your schedule while interacting with it.

This is example logs the events fired by the scheduler and its data stores (loading both XML and JSON data).
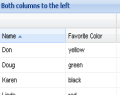
This example shows you how you can position your "static" columns in your schedule.
This is a feature packed demo showcasing grouping and 3 different row height options.
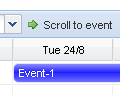
This example shows how you can scroll to a point in time, or to a specific event in your data store.
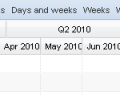
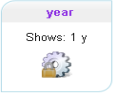
This example shows you a variety of different configuration options for the timescale. Each column can represent hours, days, weeks, months or years.
This example shows a view that is both using grouping and the locking feature.

Simple example showing how you can print your scheduled data.

This example shows you how easy it is to localize date formats and texts used in the Scheduler.
This example shows you how to create your own custom header.
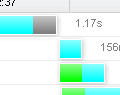
This example visualizes the loading time for different HTML resources during a page load.
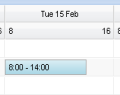
This example uses a custom time axis representing a work week with separate start/end times for the weekdays.

This example shows you how you can customize row height and event bar height.
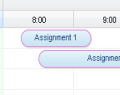
This example shows you how you can customize the time resolution used by the scheduler.
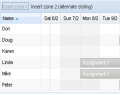
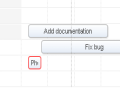
Plugin demonstration for the Zones and Lines plugins. You can add custom zones and lines to indicate special events or time spans such as vacation time or milestones.
This example shows a TimeGap plugin, highlighting periods of time that are available for all resources in the chart.
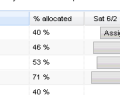
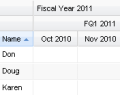
This example shows you how the new ColumnSummary plugin works. For each resource, a number indicating either the total time or percentage allocated in the current view.
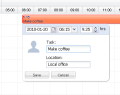
You can associate any meta data you want with a scheduled event. This example shows you the EventEditor plugin used to edit the data associated with the events in the scheduler (double click to show the editor).

Plugin allowing you to pan the schedule by clicking and dragging.
Plugin allowing you select multiple events at once by clicking and dragging.

This is an example using HTML5 and CSS3 features to create a cabin booking application.
This is an advanced example showing how you can allow your end users to generate their own custom views of their data.
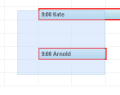
Here's an example showing how you can show multiple "rows" for a single resource. It is all done using CSS, and it's very simple to do.
Drag drop from an external grid onto the scheduler. Also includes a basic way of handling resource availability.

This example is a proof of concept showing export functionality leveraging the data URI scheme. The example has only been tested in Firefox.

This example is a proof of concept of scheduling using voice recognition. You can schedule tasks easily using your own voice.
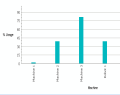
Chart example that observes the data store of the scheduler and refreshes automatically.

Simple chart example using Raphael.
This example integrates the scheduler with ASP.NET MVC (v2), using LINQ and Ext.data.JsonWriter.

Sample implementation combining Ext Gantt with classic ASP.NET, using LINQ and Ext.data.JsonWriter.
Sample implementation combining Ext Scheduler with classic VB.NET, using LINQ and Ext.data.JsonWriter.